
From domain dashboards to executive control tower.
Portfolio roll-up, workforce analytics, finance and payroll dashboards, custom report builder, scheduled exports, and executive insight packs — scoped by persona and team.
Tracopus analytics moves from domain dashboards to the executive control tower — portfolio roll-up, workforce and finance signals, custom report builder, scheduled exports, and persona-scoped insight packs. Every chart on documented screens explains its measure, scope bar, and drill-down action so metrics drive decisions instead of debates.
From domain dashboards to control tower.
Portfolio, workforce, finance, risk, and approval analytics — persona-scoped, masked, and drillable to the source record behind every KPI.
- Executive control tower
- Custom report builder
- Ask-your-data style insight packs
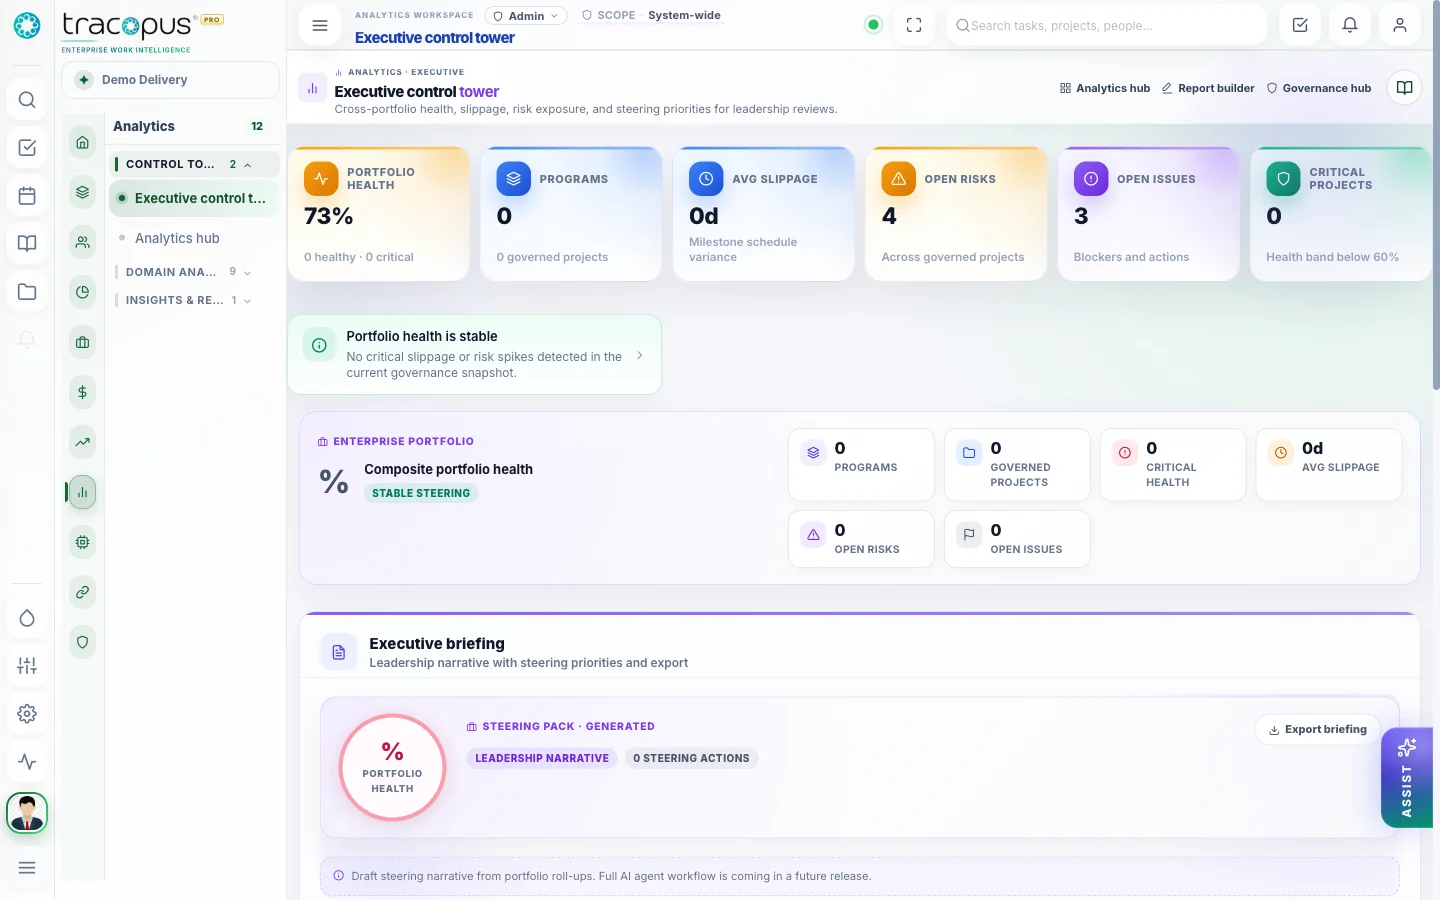
Portfolio, workforce, finance, risk, and approval bottlenecks — drillable to source.
What breaks when work lives in disconnected tools.
Point solutions optimize one department while the enterprise loses traceability — approvals stall, payroll exceptions surface late, revenue leaks between delivery and finance, and leaders reconcile exports instead of drilling from insight to source record.
- Friction 01
Mystery metrics without documentation
Undocumented charts become arguments instead of decisions — managers and executives interpret utilization donuts, pipeline funnels, and capacity heatmaps differently because nobody shares a single definition of the underlying measure and scope.
- Friction 02
Wrong scope blends company data
Team dashboards read without the org scope bar show blended company totals — managers make staffing and utilization calls on numbers that include people outside their responsibility, eroding trust in every weekly review.
- Friction 03
Duplicate BI outside daily registers
Separate BI tools duplicate filters people already use on timesheet, project list, and bid registers — creating maintenance burden and version drift between the numbers operators see daily and the numbers leadership sees monthly.
What changes when teams run on one layer.
Measurable improvements across delivery, workforce, finance, and governance — not feature checklists, but operational outcomes your teams can verify in daily work.
- Per-chart documentation on every screen guide
- Collapsible strips — expand for review, collapse for focus
- Team scope bar on manager analytics
- Twelve exportable project reports
From domain dashboards to executive insight
Portfolio roll-up, workforce and finance analytics, custom reports, scheduled exports, and persona-scoped executive insight packs.
Executive control tower
Portfolio, workforce, finance, risk, approvals, and integration health in one leadership view.
Domain dashboards
Persona-scoped analytics for HR, payroll, finance, delivery, resources, and performance.
Report builder
Custom reports with filters, scheduled delivery, exports, and executive insight packs.
Portfolio analytics
Delivery trends, overdue work, estimate gaps, risk exposure, and program roll-up.
Workforce analytics
Headcount, attendance, utilization, skills distribution, and payroll readiness signals.
Finance analytics
Revenue forecast, margin, billing readiness, leakage detection, and project P&L.
Work Graph search
Enterprise search across the connected operational graph with persona-scoped results.
Masked exports
CSV, Excel, and PDF exports respect persona context, field masking, and scope policies.
How work moves through Tracopus
Manager weekly review
Documented analytics ritual.
- 1Set Team scope on HRMS Team dashboard
- 2Expand summary strip on project list — scan estimate gaps
- 3Open team capacity Overview before staffing changes
Screens from the live workspace
Real captures from the Tracopus demo workspace — every screen a connected workflow.
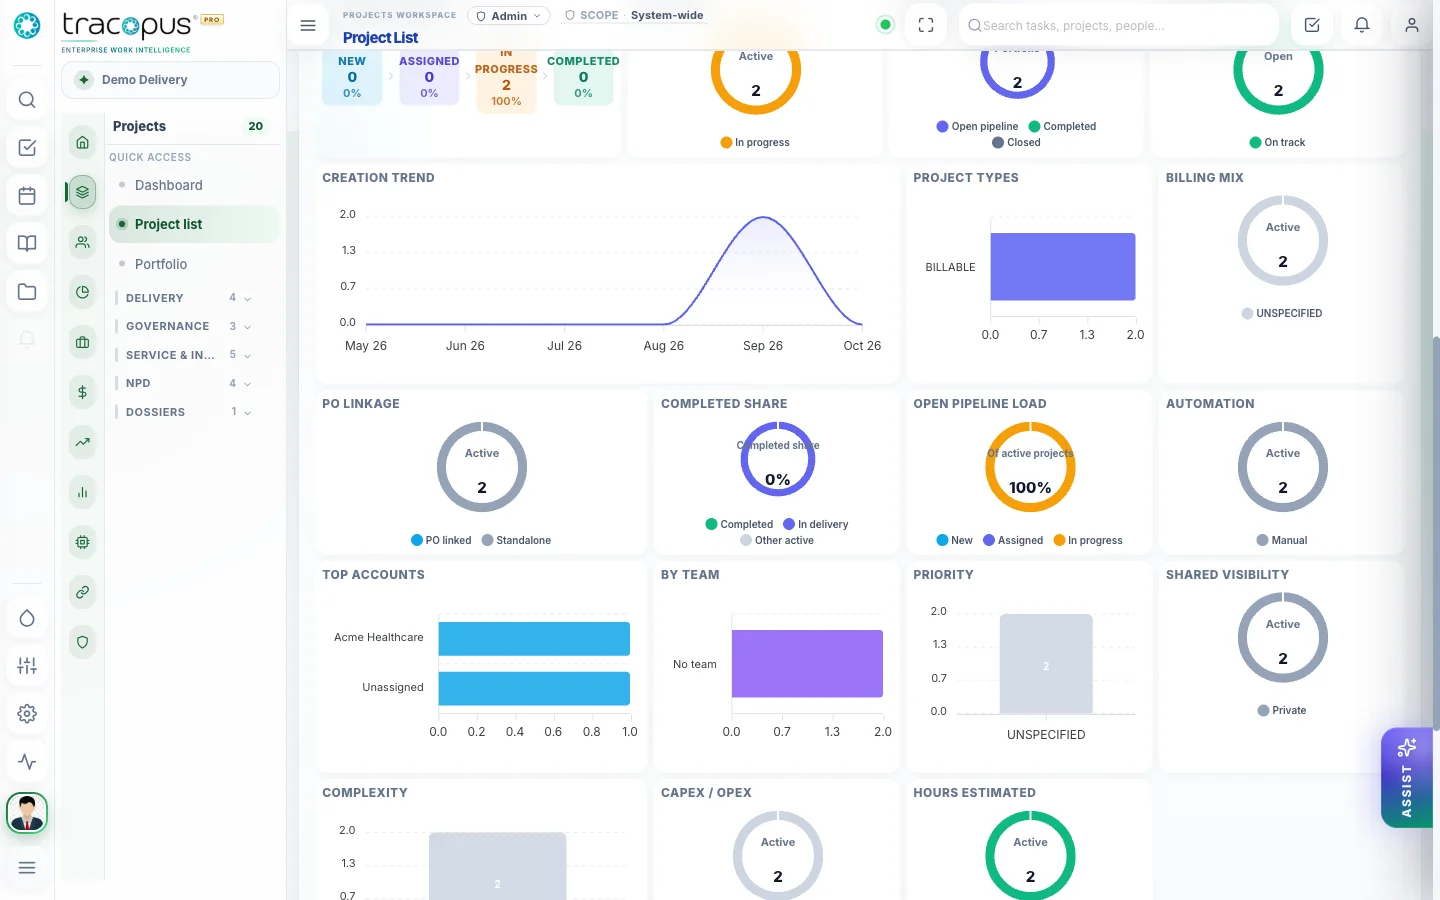
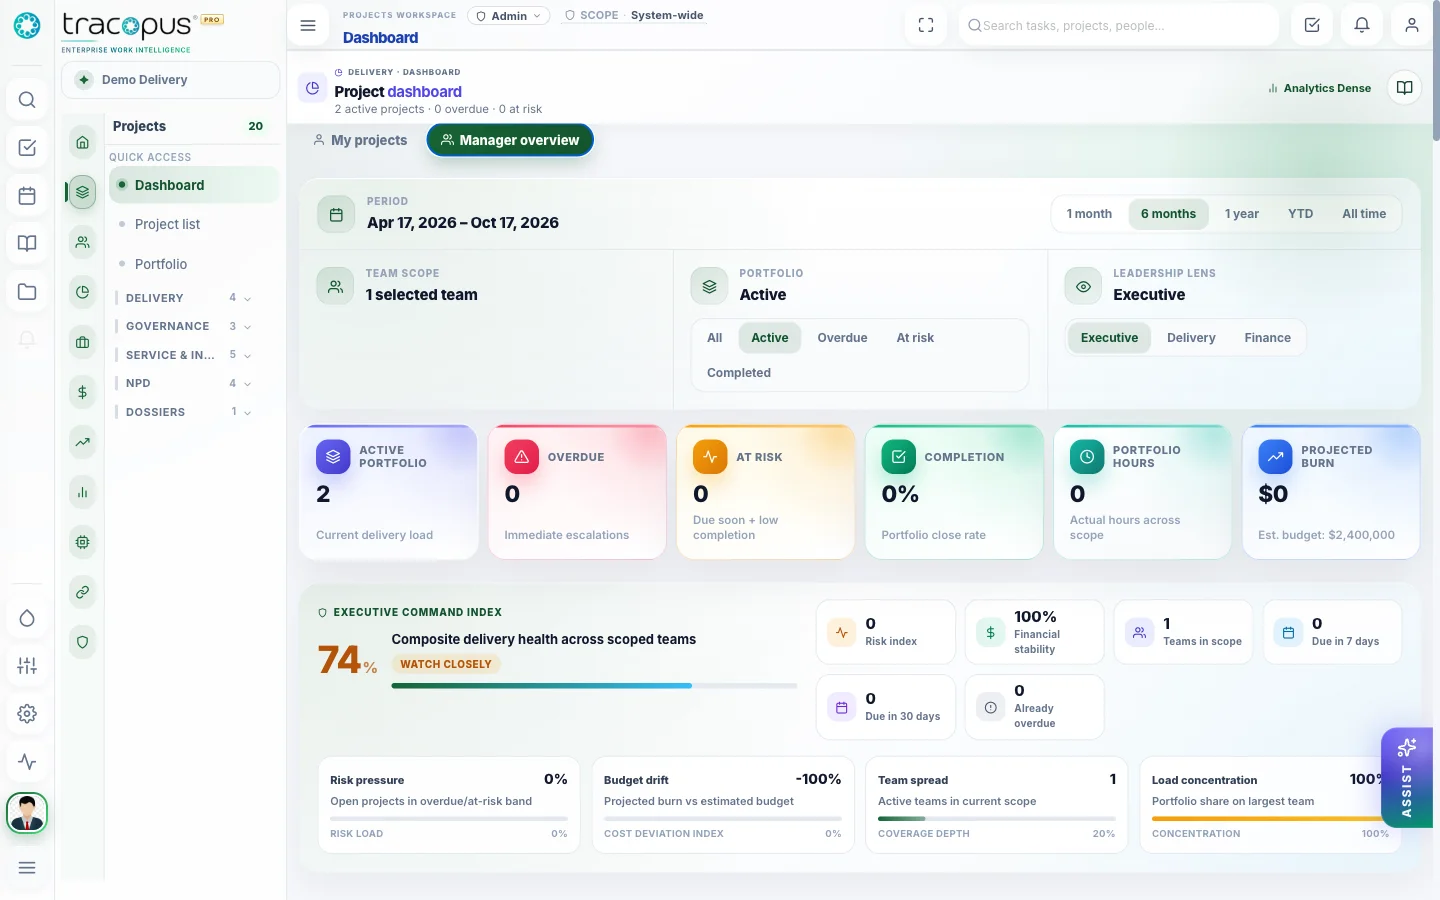
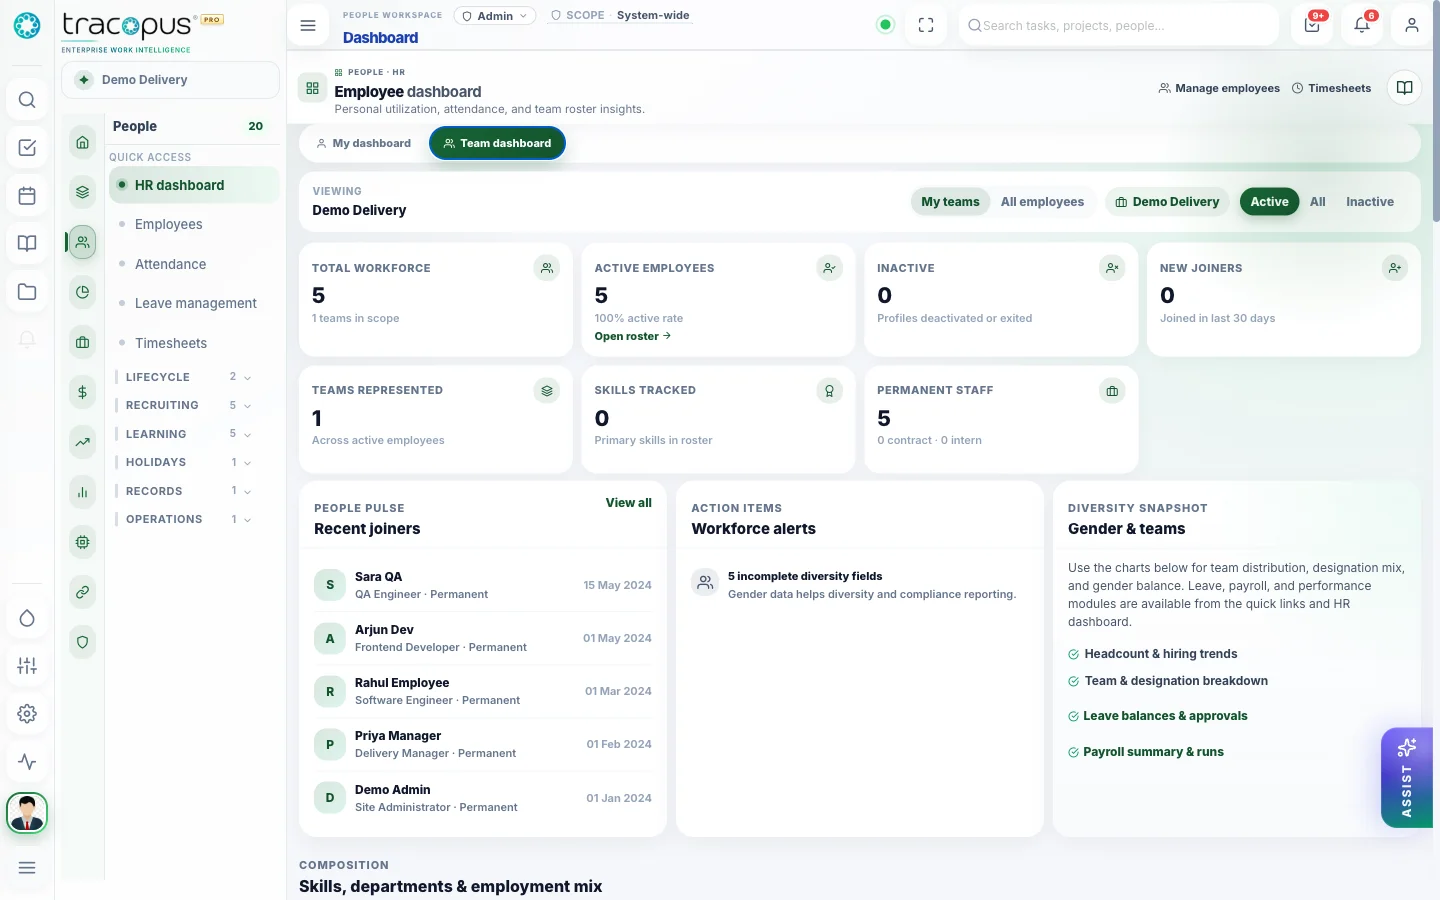
Charts explain the week without a BI export.
Questions for this module
What teams usually ask before rolling this area out.
Where are charts documented?
charts.html for types; each screen page has per-chart summary cards explaining measures and actions.
Can I hide charts on list screens?
Yes — collapse the summary strip; expand it for weekly review rituals.
One Operating Layer. Every Enterprise Workflow.
Bring workspace, people, projects, resources, finance, payroll, performance, analytics, AI agents, integrations, and admin governance into one persona-aware luxury platform.